Two Weeks With Cassandra
Note: I wrote this article a month ago, but decided it was too boring to post. Since then, various people have told me they were interested in reading it, so here it is. When I have a chance, I'll post an update.
In an attempt to side step the inevitable flames, I'm going to omit from this article the reasons we selected cassandra, and just dive right in to our experiences.
After evaluating locally, we needed to do some testing under real load. It's usually most effective to do this with actual production traffic — simulations are never accurate enough.
So, after implementing a little scala client (our app is a mix of ruby and scala) (actually, we're now using Coda Hale's cassie - don't use what I wrote: it sucks), we ordered some hardware. We decided to run with 2 nodes and a replication factor of 2. We will likely add a third if and when we start using cassandra for non-transient data. For the time being, all reads and writes are being performed at a consistency level of ONE.
Here are the specs of the machines:
- 2 x E5520 (Nehalem, 4 Cores, 8M Cache, 2.26 GHz)
- 24GB Memory
- 2 x 500GB SATA Drives
- GB Ethernet
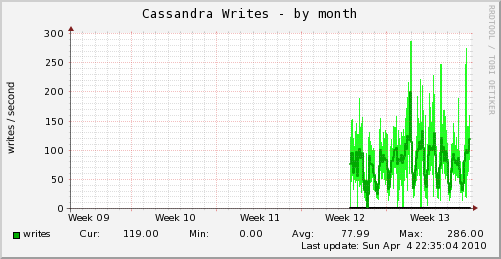
About two weeks ago, we started writing to the cluster alongside the datastore that was serving production requests at the time. This was shortly before we were trending cassandra metrics, but I believe they were peaking out at about 120 w/sec per node. Since then, we've peaked out around 300 w/sec per node.

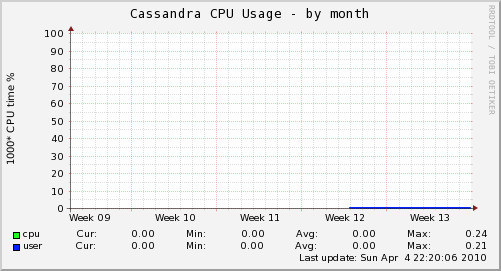
There is absolutely no noticeable load on the machines.

We did have a few problems with nodes hanging, but that seems to have been a configuration issue on my part. The problem disappeared after we moved cassandra out of runit.
After about 5 days of double-writing, we started experimenting with cutting over some reads to cassandra. Our queries consist of getting a slice (count = 20) of a CF which contains UUIDs which we multiget from another CF. What we found when we started reading was that the first query was plenty fast, but the multiget was quite slow (35+ms).
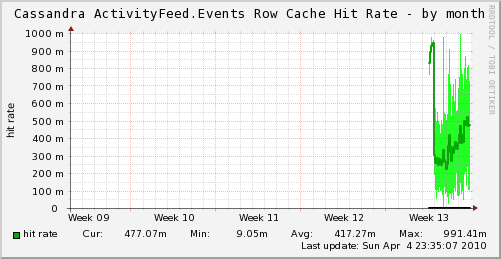
After some discussion on the mailing list, we cranked up the size of the row cache. That brought the multiget time down to around 20ms, which was a big improvement, but still far beyond acceptable performance for our application.

The folks on the mailing list were saying the numbers sounded high though, so I poked around a little more. I ran a profile of the multiget and found that virtually all of the time was being spent in thrift. I quickly implemented multiget in my scala client and found that the same query was taking around 4ms. Much better.
We wound up deciding to write through to memcached so that this particular query could be mostly (99.9%) satisfied by cache. That brought the query time down to about 6ms which is plenty fast. The moral of the story is that it can be slow to access cassandra from ruby.
Fortunately, in a future release of cassandra (it's already in trunk), apache avro will be supported as an alternative to thrift. I know the twitter guys are planning to do some work on making that really fast from ruby. So, hopefully things will be better soon.
Aside from those two issues, running cassandra has been an absolute pleasure. Our cassandra cluster is serving 100% of production requests, and the CPU usage is still hovering around 0. Let's hope the follow-up post is as boring as this one.
Update: A lot of people have been asking about the munin plugins we use to trend cassandra metrics. So, I pulled them all in to a git repo.


